Lolita Wardrobe Size VS Perception in 2016 and 2020
As we approach January, which is traditionally egl wardrobe post season, someone tagged me in a post on FB, which reminded me that I never finished and published this post. Back in 2016, I ran a survey on Rufflechat which asked a number of questions, but two key questions were:
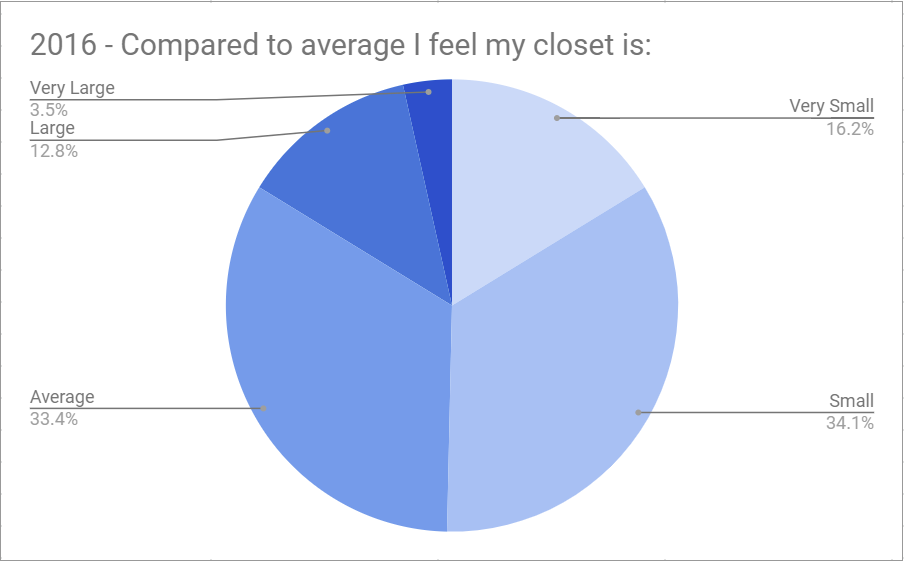
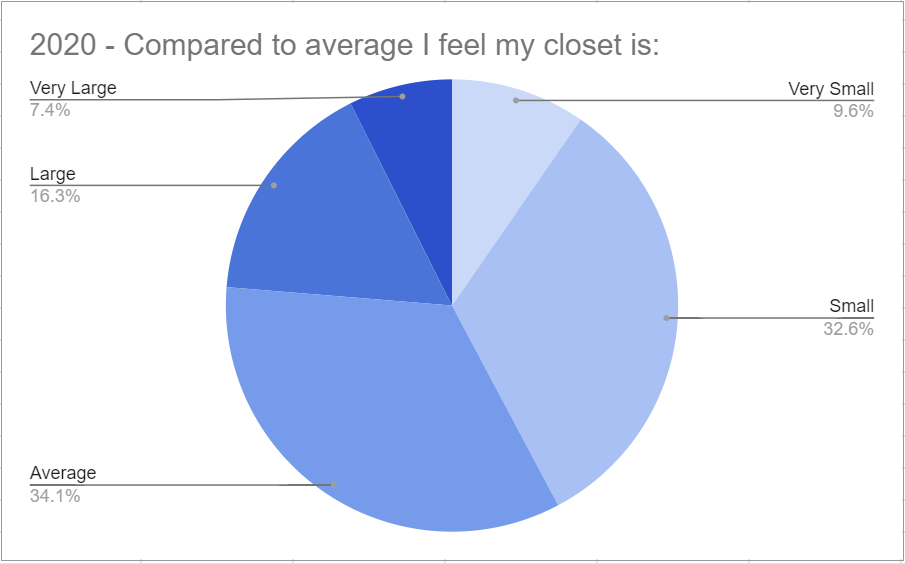
- Compared to average I feel my closet is:
- Options were: Very Small/Small/Average/Large/Very Large
- How many main pieces do you own from each source?
- Options were numerical ranges, and it asked people to specify a range for each origin: Japanese Brand/Chinese Indie Brand (Taobao)/Bodyline & F+F/Indie Brand/Print Replica/Handmade/Off-brand, Vintage & Other
- The numerical ranges were: 0/1-5/6-10/11-20/21-30/31-40/41-50/51-60/61-70/71-80/81-90/91-100/101-125/126-150/151-175/176-200/201-225/226-250/251-275/276-300/Over 300
Because I didn’t ask for a total number of pieces, this data is a little rough. I will be using the upper number from the range for each type of item added together. This will be an over-estimation of up to 24 pieces per category, so please keep in mind that this is general information and likely over estimates the data. I then re-ran the same survey in 2020, and I started typing up this post then, but an odd data point made me think that I’d made a mistake and in frustration (I really didn’t feel like starting over that day), I stopped working on the post, thinking I’d come back to it later. I didn’t. Until someone reminded me, oops.
2016 Data
Using those upper totals, in 2016, the average number of pieces from the 431 responses was 37.6 main pieces (OP/JSK/Skirt/Coat), and the median was 30 pieces.
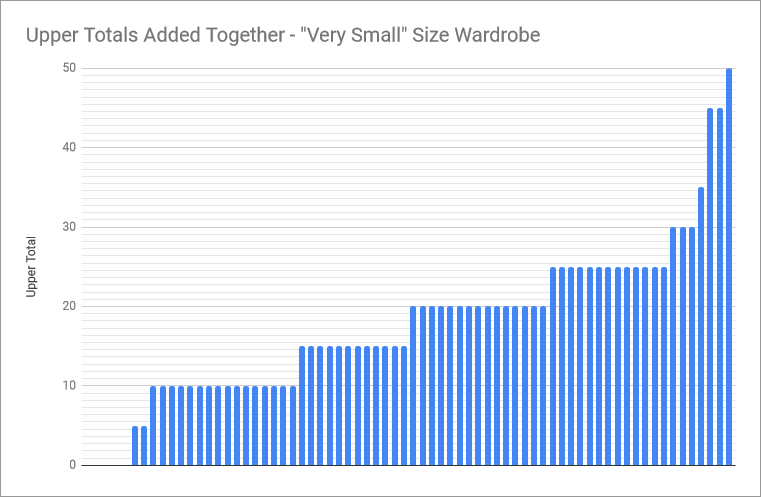
Starting from the bottom, in 2016, 70 people felt they had a very small wardrobe. Of those people, 5 had a grand total of 0 main pieces. I will be excluding those people from the averages, so, out of the remaining 65 people the average number of main pieces was 19 and the median was 20.
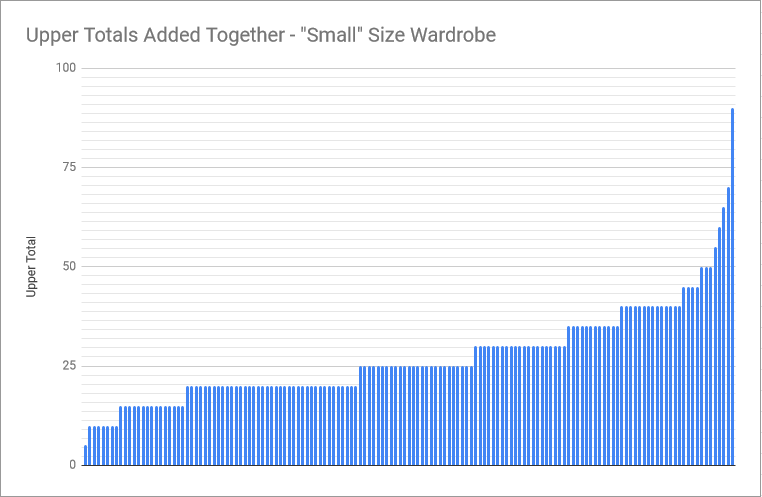
147 people (~34%) felt that they had a Small size wardrobe in 2016. In their wardrobes there was an average of 27 pieces and the median number of pieces was 25. They ranged from 5 to 90 main pieces total.
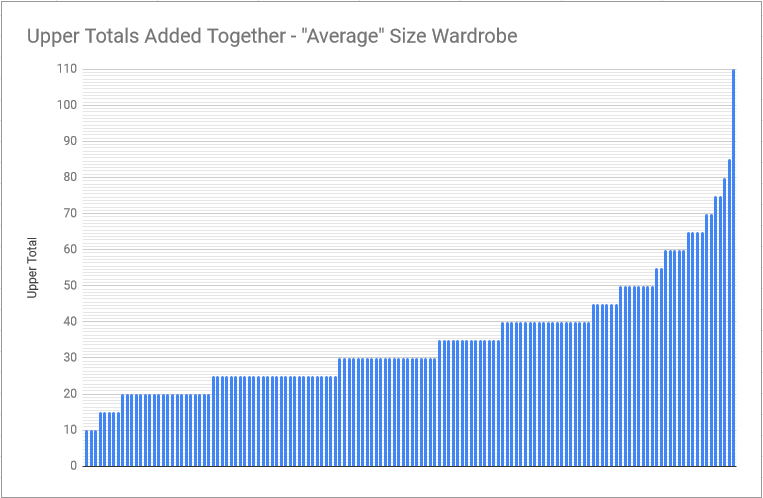
144 people (~33%) felt that they had an Average size wardrobe in 2016. Of those who felt their wardrobe was average, the average number of main pieces was 35.1 and the median was 30 main pieces. The highest total was 110 and the lowest was 10. It’s worth noting that the highest of 110 is an outlier, as the person responded that they owned 91-100 handmade items and 6-10 vintage or offbrand items. If we remove that answer, the next highest is 85 total main pieces and the average number of main pieces becomes 34.6, so, not that much lower, but it’s worth noting.
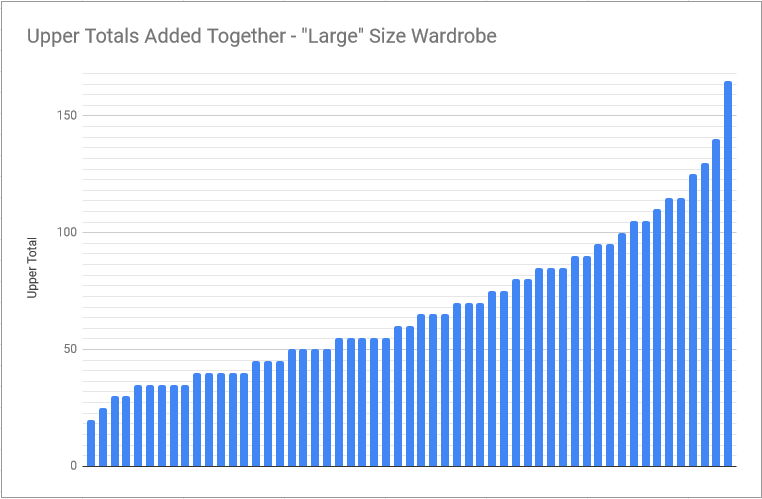
55 people (~13%) believed they had a large sized wardrobe in 2016. Their wardrobes ranged from 20-165 items, with an average of 68 main pieces and a median of 60 main pieces.
Only 15 people (~3%) believed they had a “Very Large” wardrobe. It’s not completely possible to get an average here as at least one person selected the “over 300” option, but based on the data we have, the average is 142 and mode is 105 pieces. The lowest number of pieces was a single person who responded with 6-10. The highest number of pieces is for sure over 500, because another person responded with multiple hundreds in different categories. Interestingly, of those 15 people, only 8 had over 100 main pieces. However there were 10 people in the “Large” category with over 100 main pieces, and as stated above, there was one person in the average category who said they had between 91-100 hand made items.
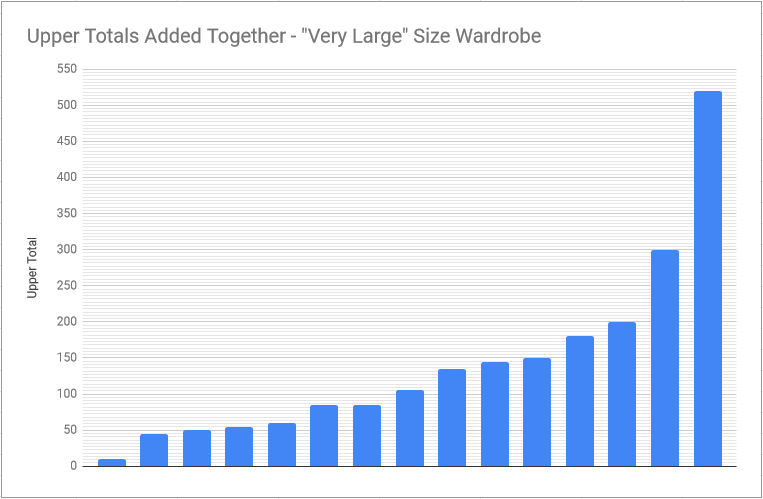
If we toss out the person with 10 or less items as an outlier, the average jumps up to 151, and the median jumps up to 120.
2020 Data
Using the same upper totals, in 2020, the average number of pieces from the 270 responses was 46 main pieces (OP/JSK/Skirt/Coat), and the median was 35 pieces. This is slight more than half as many respondents as in 2016 and is reflective of rufflechat (and facebook) becoming less popular platforms for lolita. Even so, the average went up by 9 and the median went up by 5. This suggests that wardrobes are becoming bigger over time, at least in our sample.
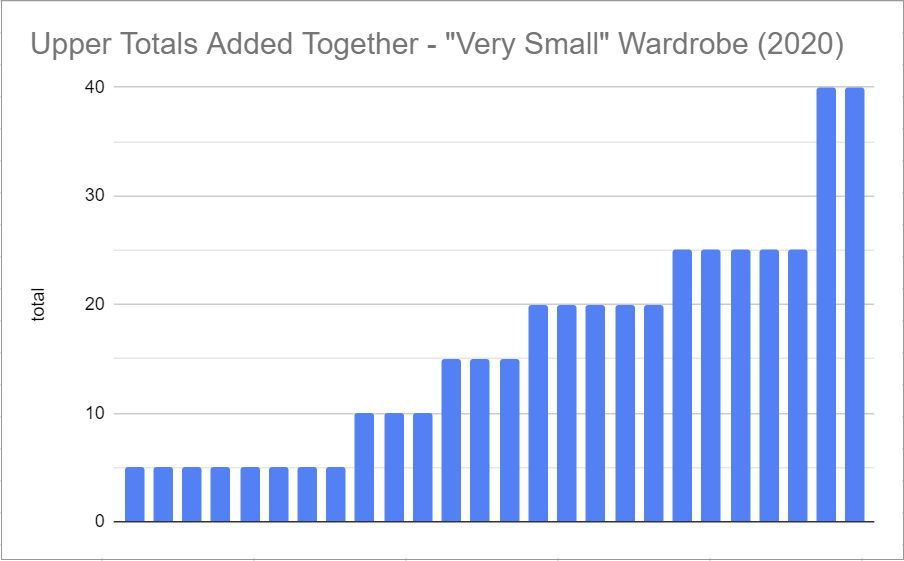
Starting off with the smallest, 26 respondents (~10%) replied they felt they had very small wardrobes in 2020. Their wardrobes ranged from 5-40 main pieces, with no one responding that they had 0 items in 2020, which is interesting in and of itself. The median number of items was 20 and the average was 17. This was very similar to 2016 where we had a median of 20 and an average of 19.
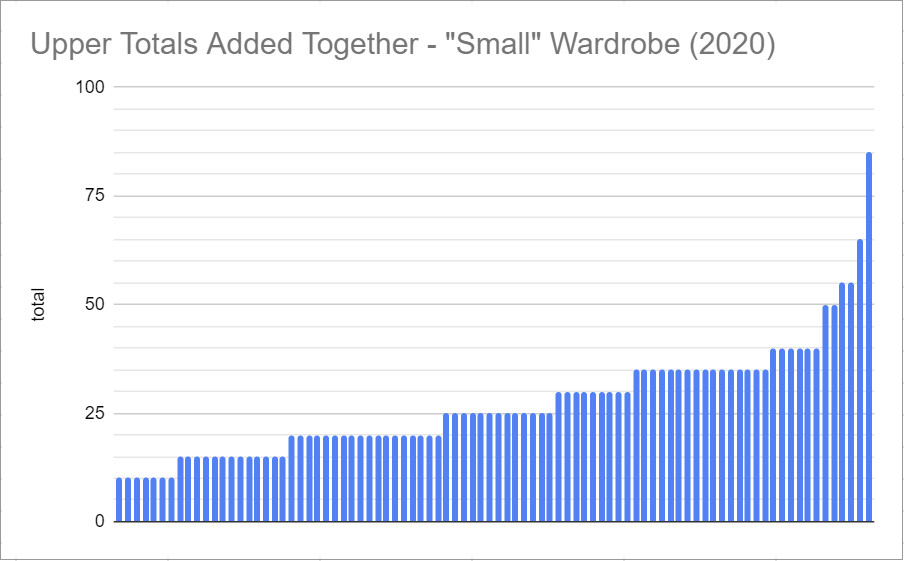
88 people (~33%) felt that they had a Small size wardrobe in 2020. In their wardrobes there was an average of 27 pieces and the median number of pieces was 25. This is also surprisingly similar to 2016, which had the same average and median. The totals ranged from 10 to 85 main pieces.
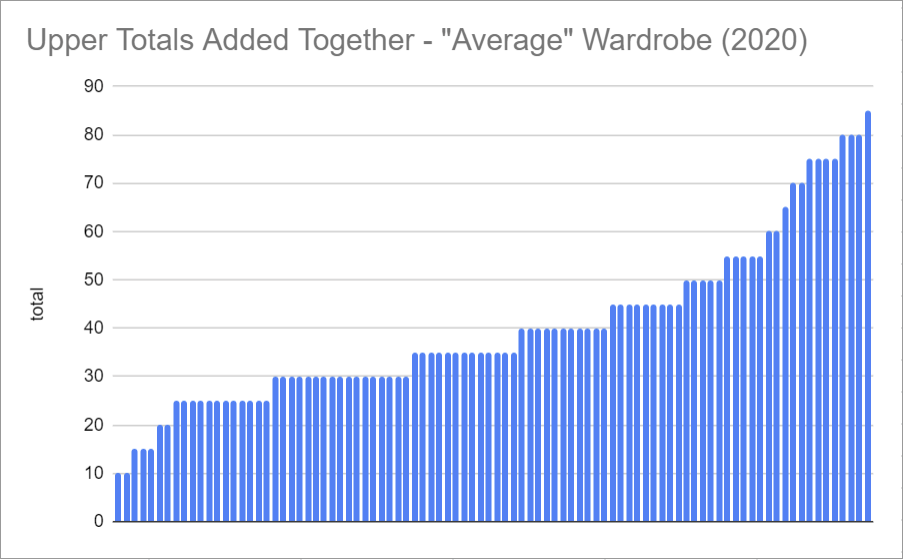
92 people (~34%) thought they had an average sized wardrobe, and their wardrobes also ranged from 10-85 pieces. Of those who felt their wardrobe was average, in 2020 the average number of main pieces was 40 and the median was 35 main pieces.
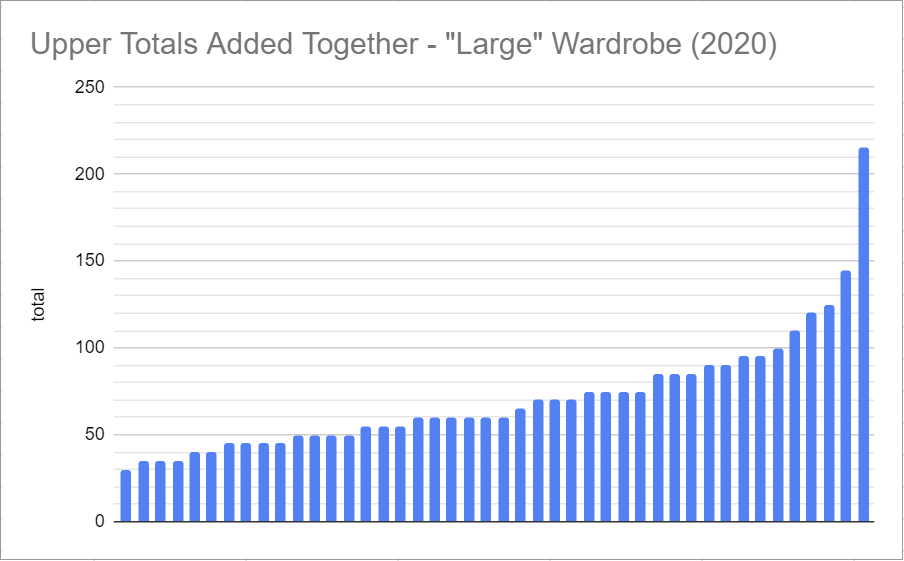
44 people (~16%) thought they had large sized wardrobes, and their wardrobes also ranged from 30-215 pieces. Of those who felt their wardrobe was average, the average number of main pieces was 71 and the median was 60 main pieces.
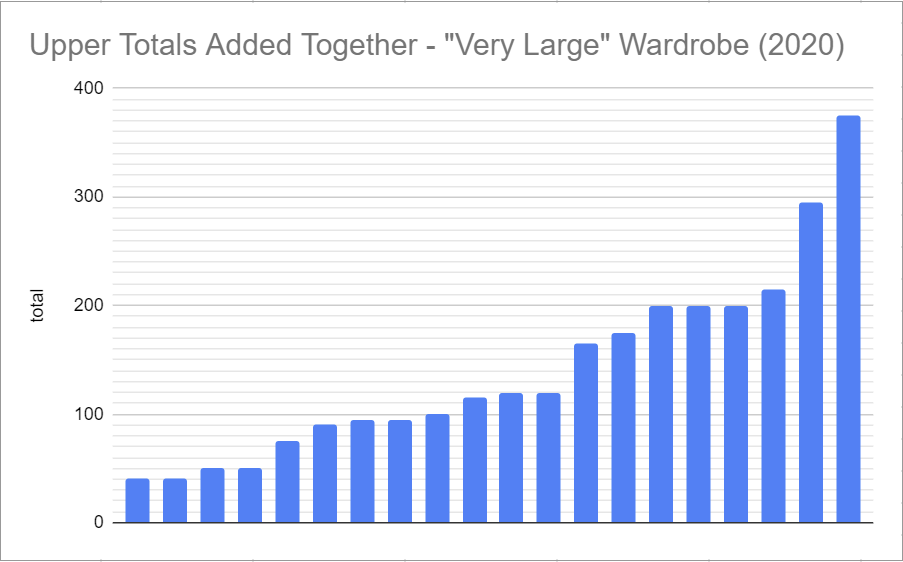
While we had just over half as many respondents in 2020, the number of respondents who believed they had a very large wardrobe went up from 15 (in 2016) to 20 (in 2022). This represents ~7% of respondents. Very large wardrobes ranged from 40 to 375+, however, it’s impossible to know the upper bound of the largest wardrobe as a single respondent replied with ‘over 300’ for Japanese brand main pieces. The average was 140 pieces, and the median was 118.
Analysis
So, we established the overall average (37.6 in 2016 / 46 in 2020) and median (30 in 2016 / 35 in 2020), but what really would be Large or Very large compared to the average? The original terms in the survey were subjective (and they were meant to be as the goal was to get people’s feelings about their wardrobe), but to compare, we really need a hard data definition, so, I’ve decided that this segmentation makes sense to me. The top 10% is “Very Large” and the bottom 10% is “Very Small”. The middle 30% is average, and the 25% on either side of that 30% is “Small” or “Large” respectively.

I’m also dropping responses where the person had 0 main pieces. That gives us 426 total responses in 2016 and 270 in 2020. Because it was done with ranges, there are a lot of duplicate responses. Because of that, I’ve made the executive decision to sort duplicates that split two ranges into the range that has the most of that duplicate result. Here is roughly what that works out to:
Very Large 2016: 70+ main pieces
Very Large 2020: 85+ main pieces
Large 2016: 35-65 main pieces
Large 2020: 45-80 main pieces
Average 2016: 25-35 main pieces
Average 2020: 30-40 main pieces
Small 2016: 15-20 main pieces
Small 2020: 15-25 main pieces
Very Small 2016: 10 or fewer main pieces
Very Small 2020: 10 or fewer main pieces
Interestingly, the ‘Average’ size wardrobe is similar to the median size for both years, however, in both years, well more than half of people who felt like they had a very small wardrobe were underestimating their wardrobe size. In fact, the largest ‘very small’ wardrobe in 2016 fit in the ‘large’ category, and the largest ‘very small’ wardrobe in 2020 was at the upper end of average.
In 2016, 8 people over estimated their way into the ‘small’ category, but 85 people underestimated their way in with the highest total being 90 pieces, which should have been in the ‘very large’ category. In 2020, only 7 people overestimated their way into the small category, while 37 people underestimated their way in. The highest total for a ‘small’ wardrobe in 2020 was 85 pieces, again in the ‘very large’ category.
In 2016, 28 people overestimated their way into the average category, but 52 people underestimated their way in. The highest ‘average’ response was 100, which again, should have put the person into the ‘very large’ category. Likewise, in 2020, the top ‘average’ total should have been in the ‘very large’ category. 32 people underestimated themselves as ‘average’ in 2020 and 56 overestimated their way in.
In 2016, only 4 people overestimated their way into the ‘large’ category, while 24 people underestimated their way in. The lowest was at the upper end of the small category. In 2020 only 6 people overestimated their way into the large category, with the lowest being firmly in the average category. 13 people underestimated their very large wardrobes as merely ‘large’.
Lastly, in 2016, a grand total of 5 people overestimated their wardrobes as being very large, including one soul who should have been in the very small category, bless their heart. The next lowest falls into our ‘large’ category though. In 2020, 4 people overestimated their way into the ‘very large’ category, and they all also fell into the ‘large’ category above.
All in all, in 2016, people were more likely to underestimate the size of their wardrobe, with more than half of people thinking their wardrobe was below average, and only ~16% perceiving their wardrobe as being above average in size.
In 2020, people were still likely to underestimate the size of their closets with 42% believing their closet was smaller than average, but the effect wasn’t as pronounced as in 2016.
It’s easy to assume that this might be that the people responding have simply been in the fashion longer, and maybe saw the results from the 2016 poll when they took it, but when you look at how long the 2020 respondents have been wearing lolita, a very large chunk of them (110, which is ~40%) weren’t around for the 2016 poll because they have been wearing lolita for 3 years or less.
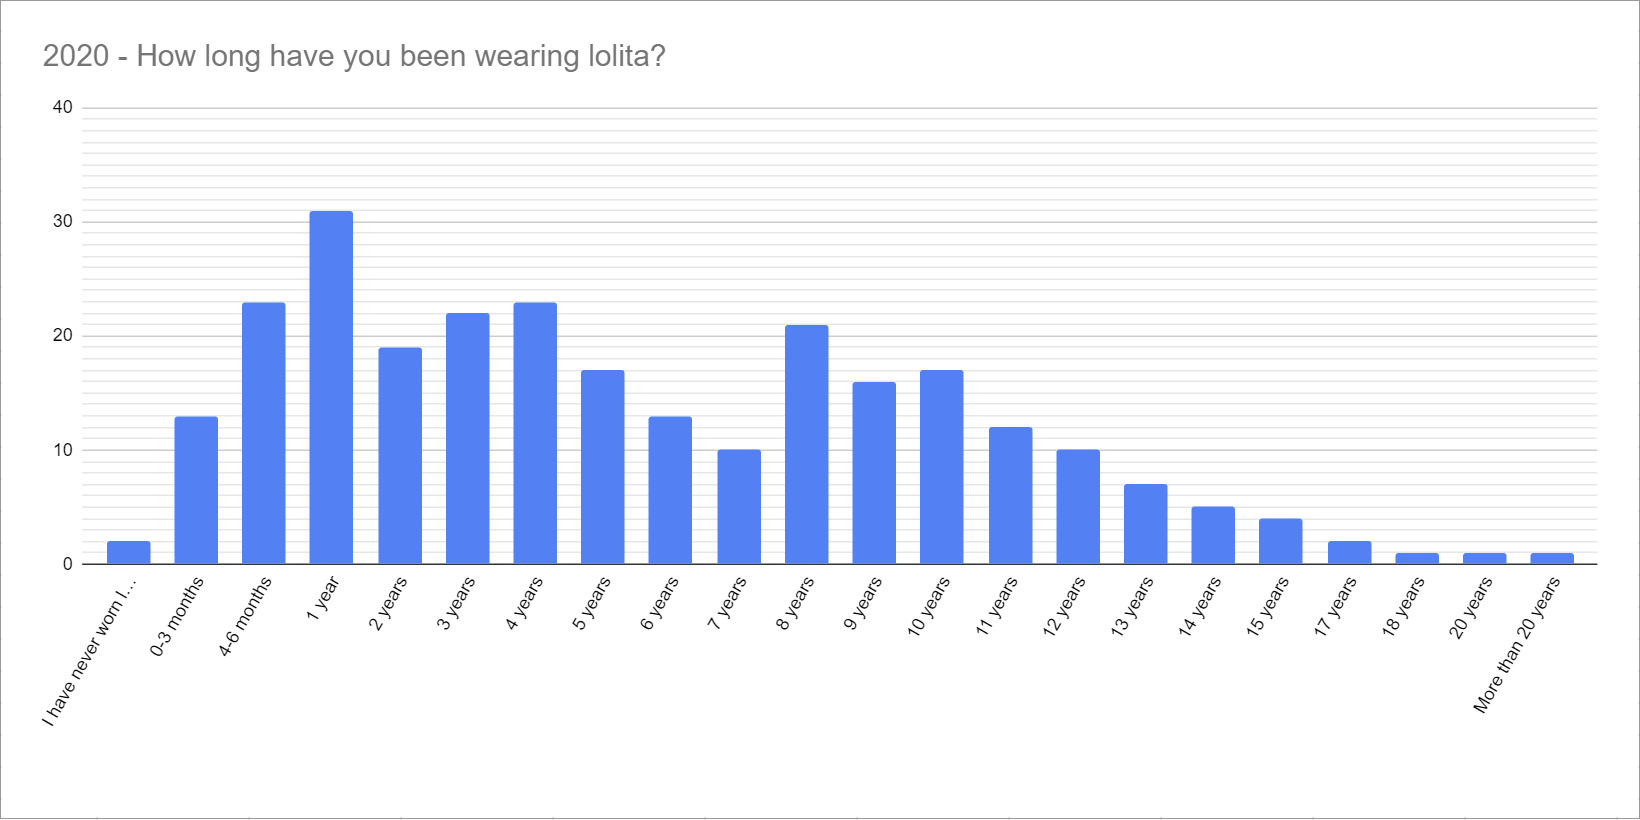
The graph from 2016 also is heavy on the newer lolita, with 209 (~49%) of them having worn the fashion for 3 years or less.
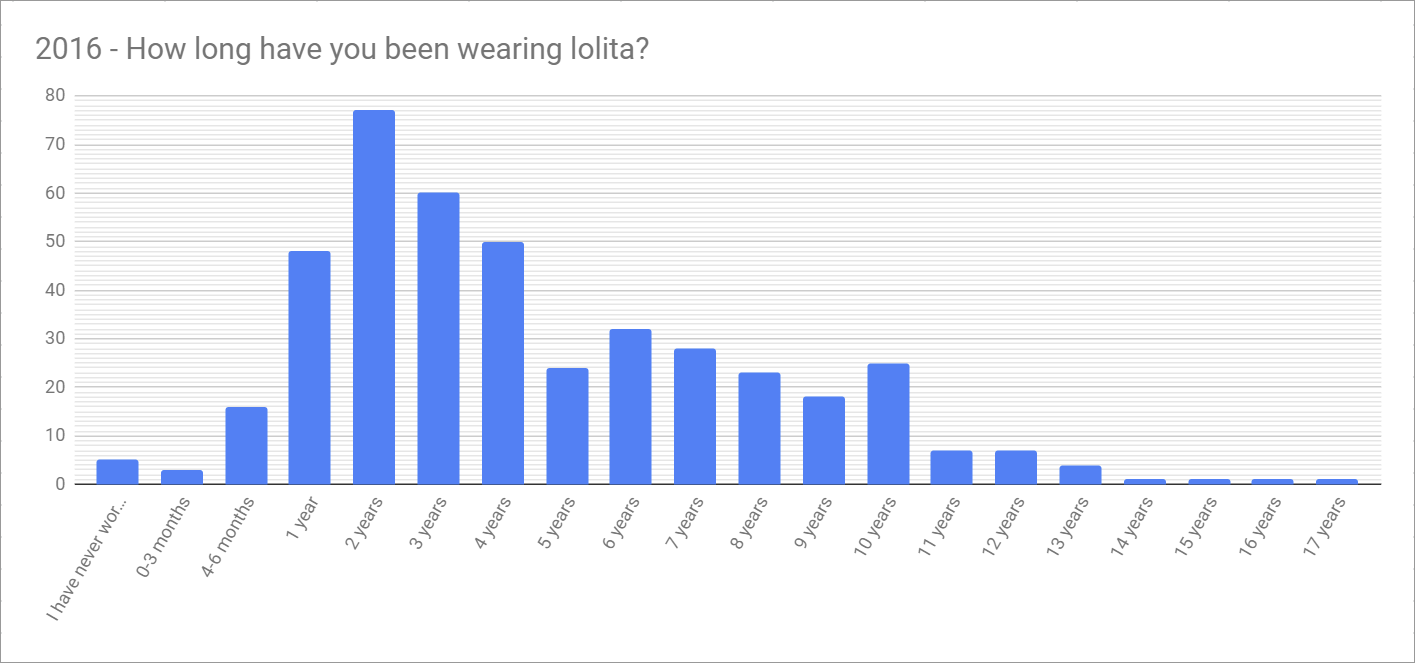
That does suggest that the 2020 poll had slightly more established lolita, but that’s going to be expected to some degree anytime you poll the community repeatedly over time. Some of us do stick around. What I think it interesting is the 2 year peak in the 2016 chart is a valley 4 years later in the 2020 chart.
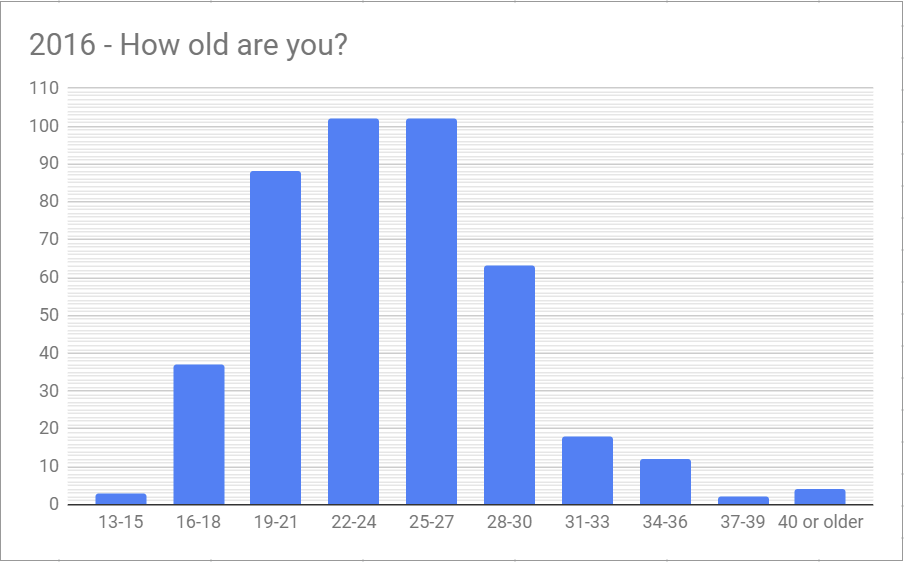
Looking at how old respondents were in 2016, shows the majority in the 19-27 range…
But by 2020, that peak was the 22-30 range…
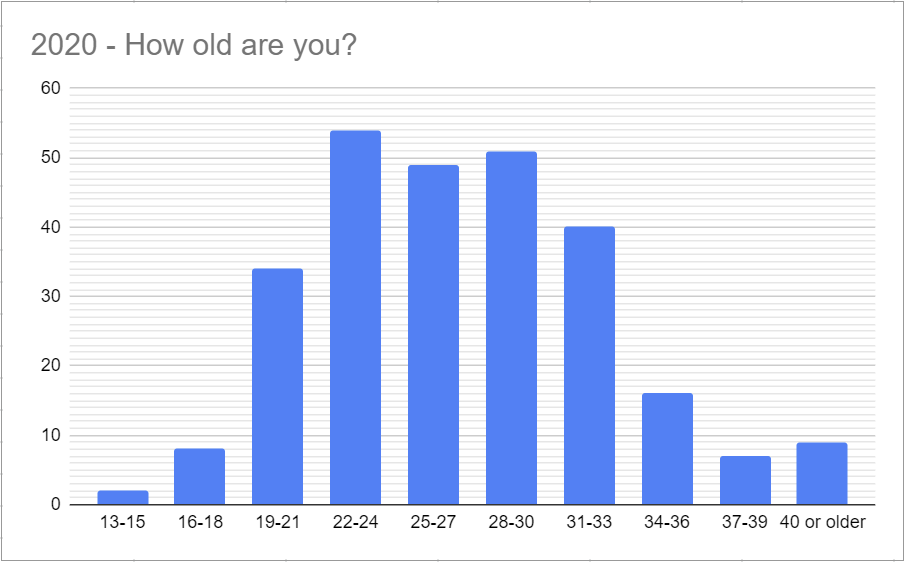
That, to me is interesting because it suggests that the audience skewed older in the 2020 version. This may be due to facebook loosing popularity with the younger crowd in general. People who are post college tend to have more disposable income than college aged students and younger, so this also could contribute to wardrobe sizes increasing between the two surveys, though this isn’t always true.
I did collect income information, but 2020 was a weird year. It’s worth noting that this is an invasive question and many people won’t answer it. It was optional and many people opted out.
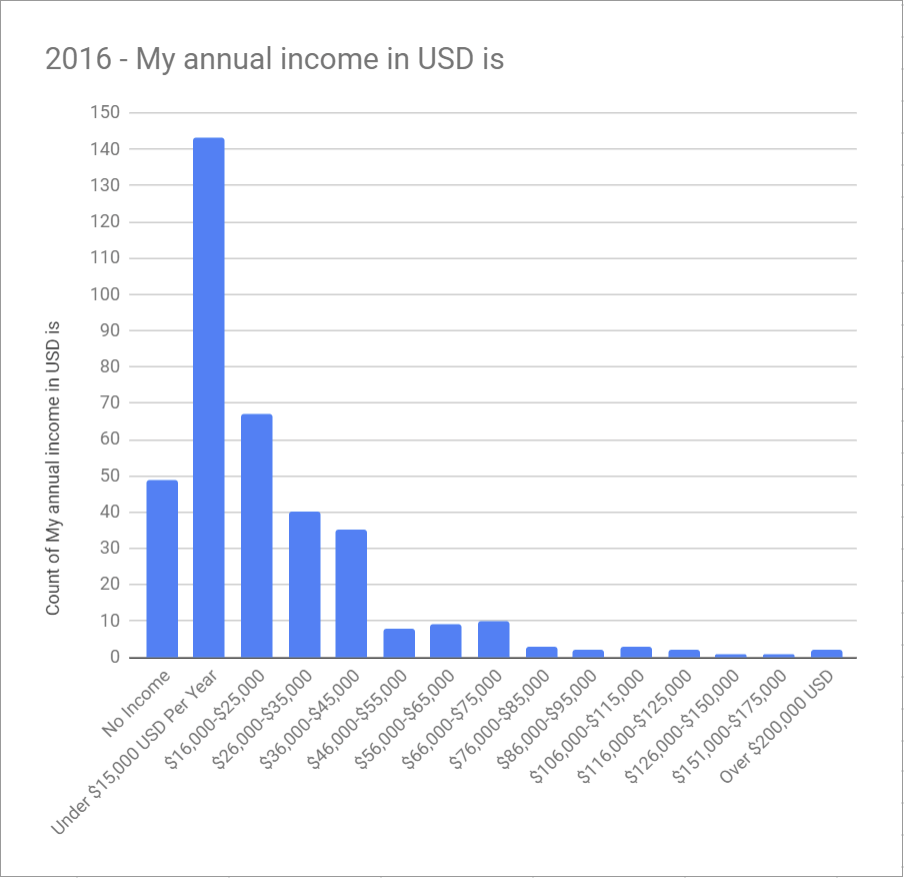
In 2020, ‘under 15K USD / year’ is still the most common answer, but there is some growth in the $26K+ area comparatively (keep in mind 2020 had just over half as many responses as 2016).
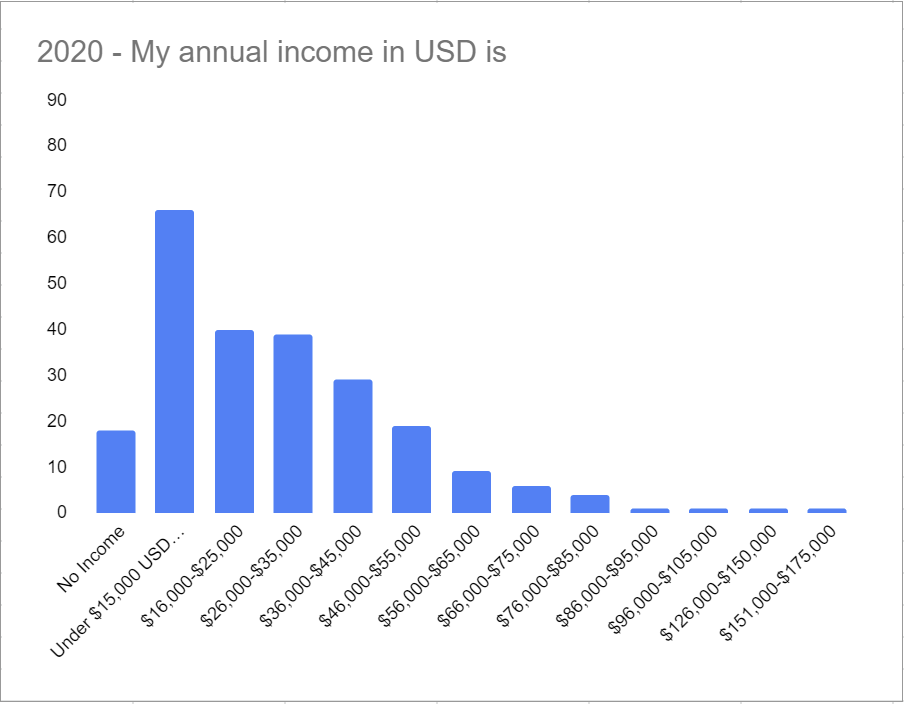
This could support the idea that the survey group skewed older and had more disposable income prior to the start of the pandemic, which could be the reason the wardrobes were larger, and not that wardrobes are just growing in general.
I did ask people to break down their wardrobe by origin to some degree, so just to look at that as well. I would have guessed that one of the contributing factors to wardrobes getting bigger would be more people buying Chinese indie items, and there was a slight increase from 13% in 2016 to 15% in 2020.
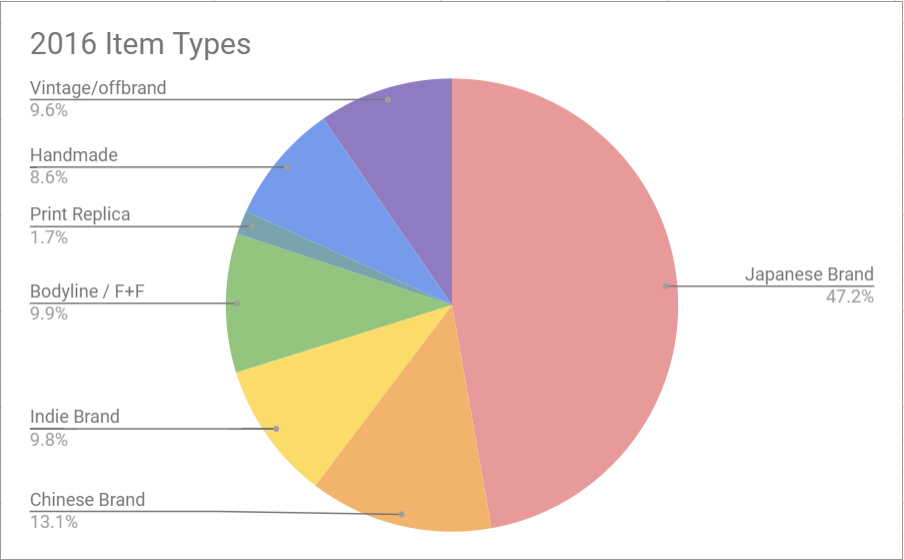
However, what is more pronounced is that literally every other category except Japanese brand and Chinese brand has gone down. The largest growth isn’t in Chinese indie brand where I would expect, but instead in Japanese brand, suggesting that people are actually buying more expensive items, not less.
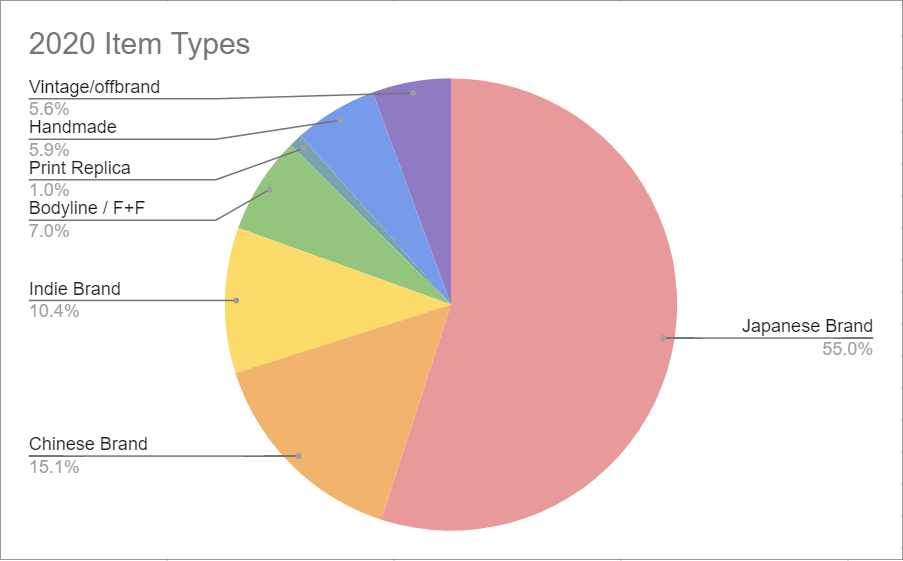
The decrease in print replicas, though small, is of course positive. The decrease in bodyline / F+F is likely due to other, better, budget friendly options being more easily available. And the decrease in handmade and offbrand/vintage is also likely due to all of the other options being more available.
All of that said, in my opinion, the best wardrobe is a wardrobe that fits your needs, your tastes and your space. What that means in size is going to vary greatly from person to person. Seeing how many people underestimate the size of their wardrobe compared to average, makes me a little sad, because it feels like the sort of thing where people are comparing themselves to others and feeling like they fall short. So as we move into wardrobe season, I encourage people to keep in mind that the wardrobes posted often are not representative of the average wardrobe, and many of the large wardrobes were built over a long period of time. I know mine was; I’ve been collecting lolita for over 13 years now! So, while it’s interesting to look at the numbers, please don’t think you need to have a certain size of wardrobe to be a “real” lolita, or a “good” lolita.
I also want to stress that the raw data collected was in ranges and I used the upper ends of those ranges. That means all of these numbers are likely over estimations. Please take all of these numbers with a grain of salt and understand these numbers are flawed.
On that note, if people are really interested in this, I can re-do the whole post with the lower end of the ranges and then compare as well to see the margin of error. But not tonight.
as someone who wasn’t well versed in lolita fashion before i stumbled upon your blog, i really appreciate all the time you put into it and your dedication to writing 🙂 it is all very insightful and interesting. thank you ! ^__^